Under co-ordination of SEXTANT, a team of
European partners has been involved in two successive European Union projects,
designed to study the feasibility of an airborne system capable of the remote
detection of atmospheric hazards, especially wake vortices. The first project,
dubbed FLAME (Future Laser Atmospheric Measurement Equipment), was completed at
the end of 1995 ; the second, which started on May 1, 1996, has been
completed in April 2000 and concerns a multifunction version of this system,
called MFLAME (Multifunction Future Laser Atmospheric Measurement Equipment).
These projects have been supported by the European Union within the scope of
the Brite Euram III programme, as part of the fourth framework research
programme.
The MFLAME consortium comprises two
manufacturers of airborne equipment (SEXTANT and BAE SYSTEMS), a company
specialised in engineering for civil aviation (SOFREAVIA), a laboratory
involved in air flow simulation (CERFACS), an organisation for Lidar
measurements (DLR), university laboratories for processing algorithms and LIDAR
simulation (National University of Ireland, Galway), and for laser crystal
research (University of Hamburg), an organisation specialised in laser and
optics simulation (INESC) and a laser manufacturer (QUANTEL).
For requirement definition, demonstration
on airport and future equipment aircraft installation, a “Users Club” was
attached to the MFLAME project as “associated partner”. It includes airlines,
aircraft manufacturers, airports and official authorities.
Wake turbulence generated by an aircraft
may be a hazard for the following aircraft. To protect against this risk,
regulations specify minimum separation between aircraft during both approach
and landing. Work is now underway to overcome this restriction, or at least to
reduce the required separation under certain conditions, which would increase
traffic capacity during peak periods and reduce saturation at heavily used
airports. In turn, this would enable postponing or avoiding, the construction
of new airports or runways, thereby considerably decreasing costs and
environmental impact.
One effective approach – ensuring the
required level of safety - is to install systems onboard aircraft capable of
remotely detecting wake turbulence. The FLAME and MFLAME projects have been
designed to define an onboard LIDAR-based system capable of detecting wake
turbulence.
In addition, an airborne remote sensing
LIDAR Doppler anemometer offers the possibility of detecting other atmospheric
hazards at long range, the most well-known of which is windshear.
The FLAME project has demonstrated the
viability of a LIDAR wake vortex detection system, including its operational
aspects. This includes the development and demonstration of the core
technologies and techniques for wake detection, particularly the laser and
signal/image processing technologies.
MFLAME project main results:
·
Extension of the multifunction
application area of the MFLAME system to include, in addition to wake vortex
detection, windshear predictive detection, even in dry air, and to assess its
predictive detection capabilities in areas such as clear air turbulence,
volcanic ash, gust alleviation, mountain rotors and hail.
·
Realisation of a demonstrator, based
on a 2 µm Lidar, with original tracking method and signal processing in
accordance with MFLAME future on-board equipment requirements.
·
Demonstration of wake vortex detection
by ground tests on Toulouse airport, so as to enable measurements in a
configuration very close to an on-board detection from a follower aircraft.
·
Improvement of techniques and
technologies for a future cost-effective multifunction airborne system
(laser/optics, signal processing).
·
Severity factor definition in the
MFLAME measurement configuration.
MFLAME achievements validate the concept of
on-board equipment for remote detection of wake-vortices, so as to guaranty the
required level of safety during approaches at reduced separation distances.
An industrial equipment for detection,
warning and avoidance of wake-vortex, windshear and other atmospheric hazards
could be brought to market within 5 to 8 years.
The initial vortex strength and structure
depend on aircraft weight, aircraft aerodynamic design and flight
configuration.
The vortex decay depends on initial vortex
strength and structure and also on meteorological conditions (wind and
atmospheric turbulences).
Present rules for aircraft spacing minima
(ICAO…) are defined to guarantee a sufficient decay of the vortices in all
weather conditions. Nevertheless some incidents are still observed.
It has been defined in FLAME with
end-users, that the objective for shorter separation distances/time in approach
phase should be 1 minute (»
2.5 Nm). Under this value, other limitations on the ground arise.
This is possible, taking into account
meteorological conditions. The wind acts on vortex decay and blows away the
vortices, and the atmospheric turbulences act also on vortex decay.
At airport level, the decision to work in
shorter separation approach mode is on ATM responsibility and linked with
favourable and sufficiently stable meteo conditions (Probability of dangerous
wake vortex on the path < 1.10-3 per approach). ATM
end-users consider that the meteo prediction validity must be more than 20
minutes.
On the ground, measurement means like
anemometers, radar, lidar, sodar, etc… are necessary (see AVOSS trials at
Dallas) to observe local meteo influence on wake-vortex evolution and to
confirm the stability of meteo conditions.
Initially, these measurement means are used
to characterise the meteorological environment of the airport.
From FLAME and MFLAME investigations, it is
clear that end-users, especially pilots and aircraft manufacturers (AIRBUS),
state as necessary an on-board detection system to guarantee the required
safety level by remote detection of possible residual wake-vortex on all the
approach path and to enable the pilot to exercise his responsibility through a
close and autonomous decision loop.
From FLAME and other studies, significant
economical and environmental impact of shorter approach separation distances is
expected by increasing aircraft movements of 10 to 15 % on major airports.
This will induce increase in airport revenue, potential fuel saving and reduced
pressure to build new runways and new airports.
The detection with a 2 µm pulsed Lidar
is now the most suitable choice. This technology is currently used in the USA
for airborne demonstrators. FLAME and MFLAME projects confirm the feasibility
of on-board equipment that must be available for transport aircraft application
in 2005-2008.
- Alert
time
From FLAME
investigations and confirmed by the User-Club of MFLAME, especially AIRBUS, two
levels of alert can be communicated to the pilot :
. Caution 30 s before estimated hazard
encounter (distance » 1,2 Nm).
. Warning 15 s before estimated hazard
encounter (distance » 0,6 Nm).
These
values are sufficient for anticipation of an avoidance manoeuvre in approach
configuration because of the low speed of the aircraft and the passengers have
belts fastened.
- Hazard
location accuracy
The hazard
location, relative to the aircraft trajectory, for warning and guidance
functions, is elaborated with the following accuracy:
. Distance accuracy: ± 100 m
. Angular accuracy: ± 0.5°.
- System
integrity
Taking into
account the occurrence probability of a wake vortex on the path (1.10-3
per approach) and the duration of the approach phase, the general integrity
requirement for an avionics equipment of 1 x 10⁹ hours of flight, is
respected with a probability of non detection by the equipment without any BITE
= 10-5.
-
Atmospheric conditions
. Shorter separation distances are used by
clear air conditions.
. From the aircraft to the maximum detection
distance, the wind gradient can be ± 3.75 m/s on the horizontal cross
direction and ± 1m/s on the vertical direction.
Taking into account the operational
requirements, the dimensions and speed variations of the vortices relatively to
the aircraft, and the attitude variations of the aircraft, the most significant
system requirements are as follows.
- Field of
view (FOV)
12° in
azimuth
3° in elevation.
-
Detection range – range resolution
Detection range : 0.8 to 2.375 km
Range gate length : 75 m
Range resolution : 75 m
Number of range gates : 21
- Spatial
resolution
Along a
line of sight (LOS) the resolution is equivalent to the range gate length:
75 m.
In a
spherical co-ordinate system, which centre is the Lidar position, the spatial
resolution (from one LOS to the other) is 2.7 milliradians in both vertical
plan and horizontal plan.
-
Measurement accuracy/resolution
Resolution
of spectral width and/or velocity: < ± 2m/s.
- Scanning
period
The Field
Of View is completely explored by the scanner within the scanning period of
3 s.
- Scanning
method – Number of LOS
The
scanning method depends on optical and mechanical feasibility. A sinusoidal
scan pattern with fly-back is used to cover the Field of View with the required
resolution and 2500 Lidar LOS are distributed on it.
-
Principal Laser characteristics
. Pulse energy : 2 mJ
. Pulse repetition frequency : 800
Hz
. Pulse length : 0,5 µseconde
. Wave length : # 2 µm (in an atmospheric window).
The optical demonstrator used for the wake
vortex detection is based on a lidar transceiver, which incorporates the laser
and the optical heterodyning in one device. The transceiver was manufactured by
CLR Photonics Inc. in Lafayette, Colorado (USA). The master and the slave
lasers used are diode-pumped Tm:LuAG lasers.
They operate on a slightly longer wavelength than Tm:YAG, which better matches
a good atmospheric window. To complete the optical detection system, a
beam-expansion telescope and scanning devices had to be integrated. The
performance parameters are summarised in Table 4.1.
Laser wavelength 2022.54
nm (Tm:LuAG)
SO pulse energy 2.0
mJ
SO pulse length (t) 400
± 40 ns (FWHM)
SO spectral width ~
1.2 MHz (0.5/t à single frequency)
Pulse Repetition Rate (PRF) 500
Hz
Output beam diameter 3.7
mm
LO / SO frequency offset 105
± 3 MHz
Output polarisation linear
Total power consumption ~
600 W
Telescope: type off-axis
magnification 20 x
clear
aperture 108
mm
Table 4.1: MFLAME demonstrator, transceiver
and telescope parameters
In order to achieve good measurements, the
emitted laser pulse has to be of a single frequency with as low bandwidth as
possible. The bandwidth of a perfect pulse is 0.4 to 0.5 (depending on the
shape of the pulse) times the inverse of the pulse length. The laser used for the MFLAME demonstrator
emits such “transform limited” pulses
Figure 4.1 shows the optical set-up used
for the MFLAME demonstrator. The laser beam from the transceiver is coupled
into an external off-axis telescope with a beam expansion of 20 times and an
aperture of 10.8 cm. This resulted in an output beam of ~ 7.5 cm diameter. The
two steering mirrors between the laser transceiver and the telescope were used
to align the beam exactly to the telescope axis. The telescope parameters are
summarised in Table 4.1.
Figure 4.1 : Optical bench, top view
For the high-speed scanning required by
MFLAME, it was necessary to develop special scanning devices. The MFLAME image
consists of a scan pattern of 3° (vertical) by 12° (horizontal). In order to
achieve a sinusoidal scan pattern of 75 vertical lines in 5 s, a fast vertical
scanner was developed. It consists of two counter-rotating prisms of 11 cm
clear aperture with a deflection angle of 0.75° each, resulting in a ± 1.5°
vertical scan. The horizontal scanner consists of a plane mirror of 20 cm
diameter with a variable well-defined scan speed up to 2°/s and a return speed
of 6° in 0.5 s. The vertical alignment of the scan pattern was performed with a
micrometer screw on the mirror scanner, while the horizontal alignment was
controlled with a PC. Both scanners were manufactured by Treffer Maschinenbau,
Bruneck (Italy) as a subcontractor to DLR. Table 4.2 summarises the
scanner parameters.
MFLAME image
Horizontal Scan Range 12°
Horizontal scanning time 5 s
Fly-back 0.5 s
Vertical Scan Range 3°
Vertical Lines per Image 75
Laser Shots per Image 2500 complete
Scan
Horizontal Scanner
Stop
Angle from 0° to 360° Software
controlled
Min. Scan Speed < 1° per Second Laser Beam
Max. Scan Speed > 4° per Second Laser Beam
Encoder 12 Bit
Pointing Accuracy 0.18° Laser Beam
Vertical Angle -20° to 20° Laser
Beam, Manual Adjustment
Vertical Scanner
Pointing Accuracy > 0.001°
Table 4.2: MFLAME demonstrator, scanner
parameters
The analogue signal is amplified with a
1-GHz, 30 to 70 dB amplifier and split using a high-speed power divider. This
enables the operation of the MFLAME data acquisition unit (developed by
Sextant) and a DLR data acquisition and quick look unit at the same time. The
data acquisition and quick look unit developed by DLR enables the operators to
analyse the system and lidar performance during the measurement campaigns. It
consists of a dual-processor Pentium II 350 MHz PC with a Signatec digitising
card with 500MHz sampling rate.
An electronic control box acquires the
scanner positions and provides a unique “LOS identification number” (LOS = Line
Of Sight) for each shot to both acquisition units via a 16-bit parallel link. A
LOS identification table provided by DLR identifies the horizontal and vertical
scan position for each LOS number.
The optical bench with the lidar system is
integrated into a mobile shelter provided BAe.
Figure 4.2 shows a photograph of the shelter at the DLR. The window
above the red wind-shielded beam output is used to enable the operator to
observe the landing aircraft and allows video documentation. A diagram of the
lidar integration into the shelter is shown in Figure 4.3.
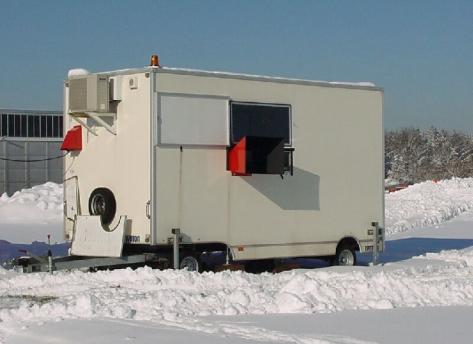
Figure 4.2: Photograph of mobile MFLAME
shelter
Figure 4.3: Diagram of lidar integration into
mobile shelter
Figures 4.4 and 4.5 show photographs of the
actual lidar set-up after the integration. In Figure 4.4, the laser is visible
on the right site of the optical bench, while the telescope is in the black
housing on the left. In front are the steering mirrors used to couple the laser
beam into the telescope. On the far corner of the optical bench are parts of
the vertical and the horizontal scanner visible. In the background is the rack
with the electronic control box. The MFLAME data acquisition unit is below the
electronic control box (hidden by the laser). Figure 4.5 shows the same set-up
from a different view. In the foreground is the reverse sight of the laser
transceiver. On the very right of the optical bench is the horizontal scanner,
with the mount of the 20-cm mirror clearly visible. The vertical scanner is the
grey box just to the left of the horizontal scanner.
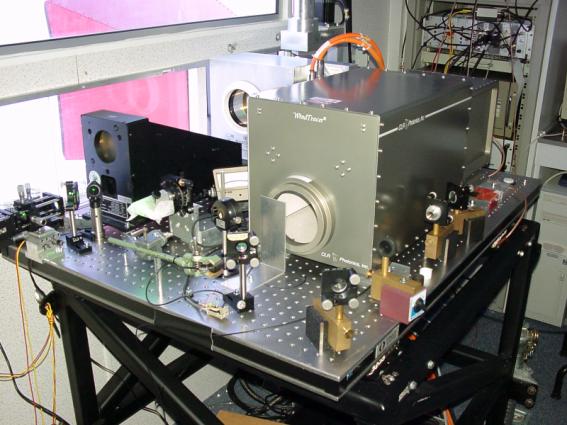
Figure 4.4: Lidar integrated into mobile
shelter
with the laser transceiver in the front and
the telescope on the left
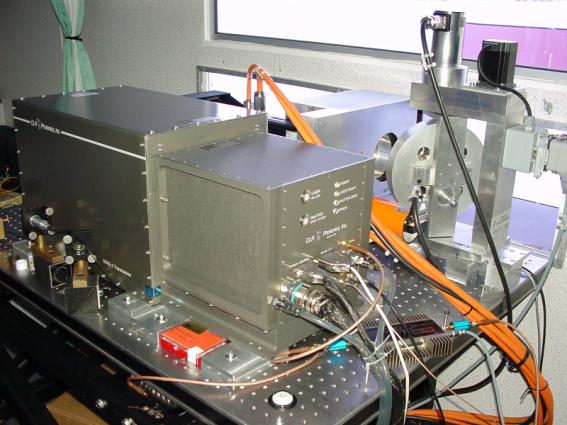
Figure 4.5: Lidar integrated into mobile
shelter
with the reverse of the laser in front and the
scanners on the right
The signal Processing and Recording Unit
(Figure 5.1) has been designed for ground and further flight tests.
This unit is linked to laser and
interferometer for acquisition of atmospheric signal, associated with a reference
signal, for each shot. Other links with the scanner enable the localisation of
each line of sight in the field of view.
In case of airborne utilisation, links with
the aircraft system allow attitude compensation for image computing.
A DAT tape recorder is used to transfer
data files from the hard disk for possible post-processing.
The main difficulty for hardware structure
and software has been the real time processing constraints for data
acquisition, storage, and image presentation to the operator (Figure 5.2).
Figure 5.1: Signal processing and recording
unit
Figure 5.2: Operator interface
In a Doppler lidar, only the component of
the air velocity in the direction of propagation of the lidar beam causes a
Doppler shift in the returned signal. Hence, it is not possible to directly
detect the rotational velocity component of a wake vortex while viewing it
axially. Consequently, detection of
wake vortices generated by a leading aircraft with an on-board Doppler system
relies on the presence of identifiable axial Doppler signatures. Such
signatures may be axial velocity components within or near to the vortex core,
or increased Doppler spectral width close to the vortex core due to turbulent
effects.
In order to investigate the feasibility of
axial detection, Large Eddy Simulations (LES) techniques were used to simulate
the evolution of wake vortices in various turbulence conditions. The three
dimensional flow fields from the LES were applied to a time domain simulation
of a Doppler lidar system. Other inputs to the Doppler lidar simulation system
are the lidar performance parameters, the atmospheric parameters, the scanning
pattern and the measurement geometry. An overview of the simulation approach
shown in experiments is given in Figure 6.1
The simulation experiments were used to
define the parameters of Doppler lidar system capable of detecting wake
vortices from an axial point of view, and then, to develop the processing
algorithms which could be used with such a system. Simulation results indicated
that lidar pulse length of about 400 ns and a scanning system with a transverse
spatial resolution of better than 6 meters would be required in order to
achieve remote axial detection out to 2000 meters.
A two stage processing approach was
developed. The first stage, known as the signal processing stage, involves
estimating the mean radial velocity and the spectral width at various ranges
along each line of sight. The second stage, known as image processing, is
applied to the results of signal processing and aims to eliminate signal
processing noise while preserving wake vortex Doppler signatures in the range
gate images.
Figure 6.1: Overview of Simulation Approach
Three phases have been planed to progress
with optics and signal processing from good wind measurements to useful
detection of wake-vortices and other atmospheric hazards, to demonstrate the
validity of an airborne detection system.
- PHASE 0:
December 1998 at DLR/Oberpfaffenhofen
·
Definition :
Optimised German ODIN system with existing
scanner and data unit.
·
Results :
Single-shot wind measurements with
encouraging results up to ranges > 2 km.
·
Observation :
The 2 µm ODIN system has a pulse length of
1 µs and a pulse repetition frequency of 100 Hz.
For wake-vortex measurements, the pulse length lead to too long range gates for
an optimised detection and the PRF is too low for the expected scanning period.
For this reason DLR decided to buy a CTI
transceiver and to put it at MFLAME’s disposal for the next test phases.
- PHASE 1
: 31 January 2000/24 February 2000 at Toulouse-Blagnac
·
Definition:
. Complete MFLAME system: Signal
processing, 2 µm pulsed transceiver and scanner.
. Comparison with DLR 10.6 µm Lidar.
. Help of sensors for atmospheric
environment (Airport meteo and Sodar/Rass).
·
Results:
. System optimisation and calibration.
. First raw data acquisitions for MFLAME
signal processing evaluation.
. Raw data exploitation demonstrates
clearly wake vortex detection capability of MFLAME.
- PHASE 2
: 06-17 March 2000 at Toulouse-Blagnac
·
Definition :
. Improved MFLAME demonstrator
. Comparison with DLR 10.6 µm Lidar
. Help of sensors for atmospheric
environment (airport meteo and Sodar/Rass).
·
Results :
. Large collection of raw data for
different aircraft types
. Complete MFLAME efficiency evaluation for
different measurement conditions
. Multifunction capability assessment
The demonstrator has the same functional
characteristics as required for the future MFLAME equipment. The only
difference is the scanning period of 5 sec instead of 3 sec due to the laser
PRF of 500 Hz.
It has been installed at the extremity of a
runway on Toulouse airport so as to enable measurements in a configuration very
close to an on-board detection from a follower aircraft (see Figures 7.1 and
7.2).
The observation direction is at the
opposite of the on-board application but the measurement aspect angle is very
similar.
Figure 7.1: Ground tests measurement method –
side view
Figure 7.2: Ground tests measurement method –
top view
The MFLAME demonstrator and the DLR
10.6 µm CW Lidar (LDA) have been installed at the extremity of runway 33 L
on Toulouse airport (Figure 7.3).
In addition to the airport meteo means, a
SODAR/RASS system was used to know wind speed and direction from 20m to 1000m
altitude by steps of 15 or 30m with a time resolution of 15 minutes, and also
to know the temperature with the same altitude and time resolution.
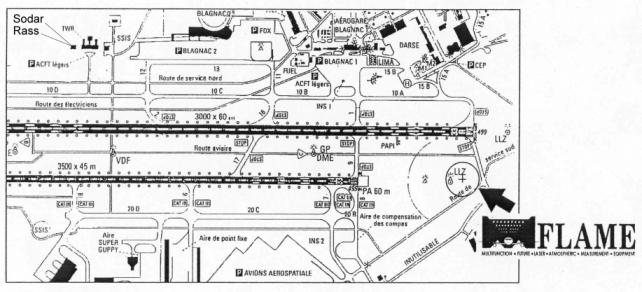
Figure 7.3: Location on Toulouse airport –
Runway 33L
At the end of ground tests phase 1 (after
calibration) and during the two weeks of phase 2, favourable weather conditions
(landing on the 33L runway most of the time) enabled the MFLAME team to make
numerous measurements. 93 landing aircraft of various types have been observed
and measurement data recorded on the MFLAME Signal Processing and Recording
Unit.
The data files were transferred regularly
on DAT tapes and sent to Galway University (NUIG) for post-processing (Figure
8.1).
Note: The processing methods used by NUIG
remain compatible with real time exploitation in on-board equipment.
A specific signal-processing unit has been
developed by DLR for optical unit development tests and calibration and was
particularly useful at Toulouse for assessment of long range detection
capabilities of MFLAME for multifunction applications (wind-shear).
The DLR LDA CW Lidar was of great interest
for location and characterisation of the wake-vortices.
Figure 8.1: Ground tests recording
organisation
For each test, the following meteo data are
available:
-
Control
tower wind
Average value : 340°/ 10 kts
- Visibility
Generally > 8 km
- Weather type (sunny, etc…)
- Wind
profile from SODAR
- Temperature
profile from RASS.
The FOV axis elevation was generally 3°,
but set at 2° for 12 tests and at 4° for 26 tests.
The FOV axis azimuth was always the same as
the runway axis.
The measurement distance was 800 to 2350 m
for 19 tests and 400 to 1950 m for all others.
Before each measurement sequence a test was
done without any aircraft for wind and noise reference.
For each aircraft test, the elapsed time
between the beginning of recording and the passing of the aircraft over MFLAME
was noted. This time allows the evaluation of aircraft distance during the
test.
The observed aircraft have been divided
into three categories:
- Light
(<30t): FOKKER 100, BAC 146, EMBRAER 120, FALCON 20.
- Medium
(30t to 100t): MD 80, MD 90, AIRBUS 319 and 320, BOEING 737, DC9.
- Heavy
(>100t): AIRBUS 330 AND 340, BELUGA.
The distribution is as follows:
- Light: 21 tests
- Medium: 58 tests
- Heavy: 14 tests.
The objective of the Ground tests Phases 1
and 2 was to demonstrate the feasibility of the MFLAME Demonstrator for
wake-vortex detection under very small aspect angles, as it is the case for a
forward-looking airborne sensor. In such way, the ground simulation of the
airborne MFLAME system could be approached by the Ground tests.
Ground test Phase 1 from 31 January to 24
February 2000 was mainly dedicated to system installation and tests, to
optimisation of measurement strategy, and to first wake-vortex measurements.
During Ground test Phase 2 from 06 to 17 March 2000, many wake-vortex
measurements could be achieved under favourable weather conditions.
The lidar instrumentation consisted of two
complementary systems, the 2 µm pulsed lidar as MFLAME Demonstrator unit and
the 10 µm cw Laser Doppler Anemometer (LDA). Optimum performance for
wake-vortex detection could be expected from the synergy of the first time used
2 µm lidar and the well-established 10 µm system.
The lidar systems were installed below the
glide slope of runway 33L approximately 530 m in front of the runway threshold.
As sketched in Figure 9.1, the aircraft are flying towards the lidar systems
passing the sensing area at an altitude of 50 - 80 m. In this configuration,
the angle between the vortex axes and the lidar line-of-sight (LOS), the so-called
aspect angle, is rather small - similar to the airborne case. The 2D sensing
area of the LDA azimuth scan covers a 80° wide arc segment in a slightly
inclined plane, whereas the 3D sensing volume of the Demonstrator field-of-view
(FOV) covers a 3° x 12° wide box of 1575 m length.
Figure 9.1: Comparison of the sensing volumes
covered by the LDA azimuth scan and the Demonstrator field-of-view.
The DLR Laser Doppler Anemometer (LDA) is
based on a cw CO2 laser, a 30 cm diameter telescope and a
flexible scanning device. It is well established for basic short-range (100 -
200 m) wake-vortex measurements. In the MFLAME Project, it has been used to
support the measurements of the Demonstrator unit.
A step-by-step approach has been chosen to
approach the MFLAME objective. At first, elevation scans perpendicular to the
glide-slope direction have been carried out to measure in well-known
configuration the radial velocity field of the vortices. For example, the
signatures of a MD83 vortex are shown in Figure 9.2. The colour-coded intensity
plot represents frequency spectra versus spectrum number, respectively LOS
velocities versus time. Around 18 s after aircraft passage, the typical pattern
of the radial velocity field can be observed, consisting of the velocity
increase towards the vortex core near spectrum no. 1433, the change in velocity
sign inside the core, the second maximum on the opposite side of the vortex
core, and the velocity decrease outside the core. The lower part of Figure 9.2
shows, for example, the frequency spectrum no. 1439 with a LOS pointing through
the vortex in core vicinity. It consists of several peaks whereby the outer
edge of the last peak near channel 120 is representing the highest velocity for
this LOS of more than 10 m/s.
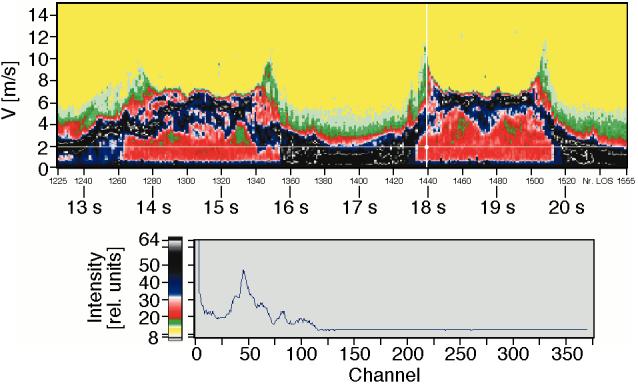
Figure 9.2: LDA signatures of the radial
velocity field of a MD83 wake vortex.
The next step was to point the laser beam
parallel to the glide-slope direction at constant elevation angle (9°). In this
way, the first signatures of the velocity field under small aspect angles could
be acquired. That led to the final configuration for wake-vortex detection by
the LDA system, sketched in Figure 9.1 as “LDA azimuth scan“: a continuous
azimuth scan at small elevation angle resulting in slightly inclined sections
through the vortex pair.
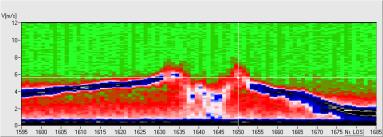
An example of wake-vortex detection by LDA
azimuth scans is given in Figure 9.3 for an A330 vortex pair. The upper trace
shows the beam orientation (LOS) during 27 continuous azimuth scans between
100° and 180° at constant elevation angle of 10° and constant range of 150 m.
The lower part shows a frequency spectrum measured before the aircraft passage
(indicated by the position of the vertical cursor in the intensity plot). It is
characterised by a pronounced wind peak near channel 45, corresponding to a LOS
velocity component of 3.8 m/s. The intensity plot shown in the middle of the
figure consists of 5120 colour-coded frequency spectra measured during a period
of 130 s with intervals of 26 ms. Before the aircraft passage at t = 0 s we
observe a regular arc-shaped pattern of the wind peak which arises from the
continuous oscillations of the LOS between the wind direction and the direction
perpendicular to the wind. After aircraft passage, this regular pattern is
overlaid by small-scale velocity components arising from the vortex pair
descending through the LDA sensing plane. From that, it takes more then 75 s
until the regular signatures of the undisturbed wind field are appearing again.
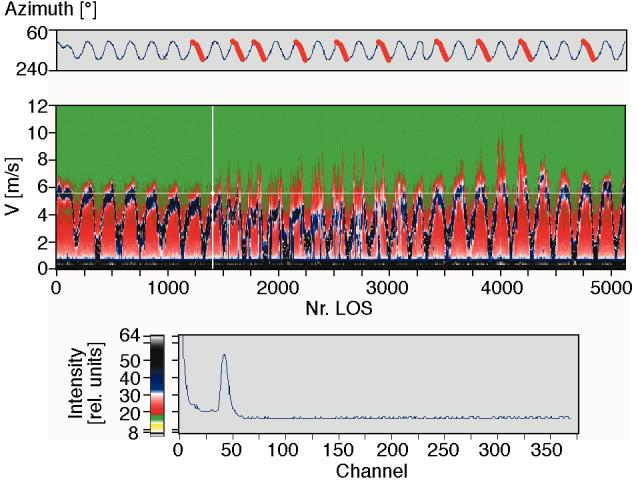
Figure 9.3: LDA measurement of an A330 vortex
pair.
-
Upper trace: beam orientation (LOS) during 27 continuous azimuth scans between
100° and 180° at constant elevation angle of 10° and constant range of 150 m.
-
Middle: intensity plot consisting of 5.120 colour-coded frequency spectra
measured during a period of 130 s with intervals of 26 ms.
-
Lower part: frequency spectrum measured before aircraft passage.
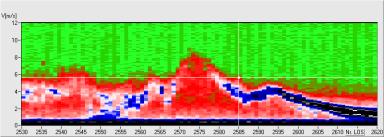
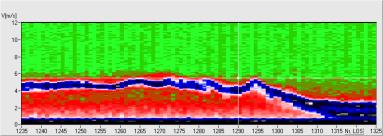
A closer look to the A330 signatures from
Figure 9.3 is given in Figures 9.4 and 9.5, by ten expanded sections of azimuth
scans each reaching from 100° to 180°. They are marked in red colour in the
upper trace of Figure 9.3. The vertical cursor is indicating the direction of
the approaching aircraft from direction 150°. Only 2 s after aircraft passage
we can observe the first superposition of the normal wind pattern by the
signatures of the descending wake vortex. This signature becomes clearly the
shape of a pair of vortices (7 s) showing increasing vortex diameters with time
(17 s, 26 s, 36 s). These organised flow patterns are turning into turbulent
components within the next three pictures (50 s, 60 s, 69 s). After that, the
pattern of the undisturbed wind field (84 s) as it was before (8 s before
aircraft passage) is established again. The descent of the vortex pair is
overlaid by a lateral transport from the direction of the aircraft passage
(150°) to the left side of the picture, indicated by smaller azimuth angles.
This movement is due to the cross component of the surrounding wind field of
roughly 1.8 m/s.
In summary, the LDA measurements have
clearly demonstrated that the wake-vortex signatures are detectable at short
ranges even under small aspect angles. This has given an optimistic basis for
the long-range vortex detection to be carried out by the MFLAME demonstrator.
8 sec before
aircraft passage
2 sec after
7 sec after
17 sec after
26 sec after
100°
azimuth scan à 180°

Figure 9.4: LDA signatures of the A330 vortex
pair shown in Figure 9.3,
for
ten expanded sections of azimuth scans from 100° to 180°. The vertical cursor
indicates the direction of the approaching aircraft from 150°.
36 sec
after
50 sec
after
60 sec
after
69 sec
after
84 sec
after
100° azimuth scan à 180°
Figure 9.5 : Continuation of Figure 9.4
for
the period from 36 s to 84 s after passage of the A330 aircraft.
In order to evaluate the performance of the
lidar system, wind measurements at long ranges were performed with the DLR
specific 2 µm signal processing unit. Data were analysed as single-shot
measurements and as 5-shots accumulation. The measurements were taken parallel
to the glide path (3° elevation), but with stationary scanners.
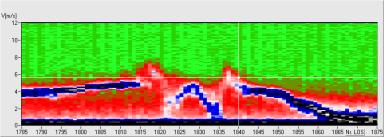
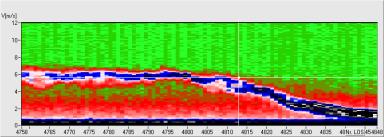
An example of single-shot measurements is
shown in Figure 9.6, where the line-of-sight (LOS) component of the wind vector
is drawn in the upper part of the figure for one single shot. The values below
0.5 km are not representative, since they might be disturbed by the outgoing
laser pulse. Between 0.5 km and 4.0 km, the slope of the wind component is
smoothly developing around a value of – 3 m/s. The negative sign indicates wind
components directed away from the lidar system. Beyond a range of 4.0 km,
several stray values due to insufficient signal-to-noise ratio are occurring.
The same behaviour can be observed in the intensity plot in the lower part of
the figure, where 200 single-shot LOS profiles are drawn. Here, the stray
values, indicated by the solitary dots, are showing increasing frequency beyond
3 to 4 km range.
Figure 9.6: Single-shot wind measurement with
9 km maximum range.
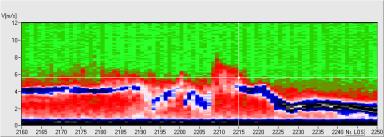
In Figure 9.7, the results of 5-shots
accumulation of the data shown in Figure 9.6 are presented. For example, no
stray values are occurring in the chosen accumulated profile, as shown in the
upper part of the figure. Moreover, the small number of stray values in the
intensity plot (lower part) indicates the benefit of the accumulation of
single-shot measurements. At least in the atmospheric boundary layer, maximum
ranges of more than 10 km can be achieved by accumulation of few single-shot
measurements. This is an important conclusion with respect to the
multi-function objective of the MFLAME project
Figure 9.7: Wind measurement from Figure 9.6
with 5 shots accumulated.
The archived data from the phase 1 and
phase 2 of the ground tests were transferred to NUI, Galway for processing and
analysis. Prior to application of the MFLAME processing algorithms the lidar
signal were corrected for gain difference caused by the automatic gain control
of the recording system and for frequency shifts caused by jitter in the
frequency of the outgoing lidar pulse.
The MFLAME processing approach involves two
stages: signal processing and image processing. The aim of the signal
processing stage is to estimate the mean radial velocity and the spectral width
at various ranges along each line-of-sight. For this application, mean radial
velocity estimation is carried out over 75 meter range gates, while spectral
width estimation is carried out over 225 meter range gates.
In the image processing stage, mean radial
velocity and spectral width estimates from all range gates that are equidistant
from the lidar are used to generate transverse, range gate images. If a
rectilinear scanning scheme was employed the construction of these images would
be straight forward, as each mean velocity and spectral width estimate could be
mapped to each pixel in mean velocity and spectral width range gate image.
A sinusoidal scanning pattern, however,
results in a highly non-linear spatial distribution of estimates. Such a
distribution does not facilitate image processing or image display. Therefore,
a dedicated approach has been developed in order to convert the sinusoidally distributed
velocity and spectral width estimates into a set of rectilinearly distributed
velocity and spectral width estimates, while simultaneously allowing the
implementation of noise reduction algorithms and preserving wake vortex Doppler
signatures in the range gate images.
The off-line processing approach used at
NUI, Galway is similar to that implemented in the MFLAME real time signal
processing system. However, in the real time system, only the mean radial
velocity is available after signal and image processing. It is intended to add
the spectral width signal processing and image processing stages in the next
version of the demonstrator software.
Airbus
A340 vortices in the FOV
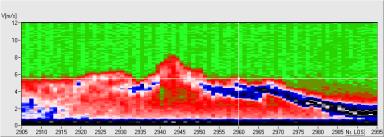
An example of the results of image
processing is shown in Figures 9.8 and 9.9. This case involves an Airbus 340
landing at 13:38 on the 9th of March 2000. The local wind
information provided by the control tower indicated that wind was from 330° at 3 knots. The elevation of the central axis of the FOV was set to
4°.
Figure 9.8 shows the average top view of
the mean radial velocity and a series of range gate images from scan 5 of this
case. Figure 9.9 presents the spectral width results for the same scan in a
similar format. A pair of spectral width signatures is clearly visible in
Figure 9.9, in both the average top view image and in the individual range gate
images between ranges 400 to 1400 meters. Beyond 1400 meters one of the
vortices seems to have dropped out of the FOV and beyond 1800 meters both
vortices seem to have dropped out of the FOV.
Using the vortex positions identified in
Figure 9.9, axial velocities associated with the vortices can be identified in
the range gate images of Figure 9.8. However, other turbulence structures are
present in the radial velocity images, so axial velocity signatures are not as
identifiable as the spectral width signatures.
The aircraft over-flew the MFLAME shelter
approximately 2 seconds after this scan was completed. Assuming an aircraft
speed of 75 m/s, the vortices in Figure 9.8 and 9.9 can be calculated to be
approximately 4 seconds old in range gate 1, 5 seconds old in range gate 2, 6
seconds in range gate 3, etc. (as consecutive range gates are 75 meters apart).
The tick marks along the axes of the range
gate image, which are separated by 20 meters, can be used to estimate the
vortex signature separation. Between range gates 4 and 14 the separation of
spectral width signatures seems to be stable at approximately 80 meters. The
approximate vortex ages corresponding to these ranges can be calculated to be 7
and 15 seconds respectively. This estimated separation is slightly larger than
the wingspan of an Airbus 340. However, it should be noted that the spectral
width signature has not been shown to coincide with the cores of the vortices,
so conclusions about core separation should not be drawn without further
investigation.
Figure 9.8: Radial velocity images with A340 wake vortices in the FOV.
The left panel shows the
average top view representation of the estimated mean radial velocity, while
the right panel shows individual range gate images. The mean radial velocity of
each range gate images has been removed. The ‘+’ symbols on the top view image
mark the centres of the range gate images shown. Tick marks on the range gate images
are separated by 20 meters on each axis of each image..
Figure 9.9: Spectral width images with A340
wake vortices in the FOV.
The left panel shows the average top view
representation of the estimated spectral width, while the right panel shows individual
range gate images. The ‘+’ symbols on the top view image mark the centres of
the range gate images shown. Tick marks on the range gate images are separated
by 20 meters on each axis of each image.
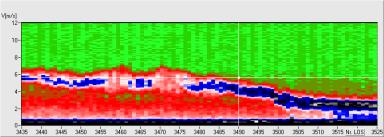
Airbus
A320 vortices in the FOV
A second example involves an Airbus A320 in
the approach to land at 13:01pm on the 9th March. Figure 9.10 shows
the average top view of the mean radial velocity and a series of range gate
images from the 5th scan of the FOV. As in
the previous case, the average radial velocity of each range gate image has
been subtracted in order to reduce the range of velocity in the image set.
Figure 9.11 presents the spectral width results for the same scan in a similar
format. Spectral width signatures are clearly visible in Figure 9.11 in both
the average top view image, although unlike the A340 case, separate spectral
width signatures are not visible for two vortices.
As in the previous case, the vortices’
location can be identified via the spectral width images, and then axial velocities
associated with the vortices can be identified in some of the range gate images
of Figure 9.10 However, other turbulence structures are again present in the
radial velocity images. The spectral width signatures are clearly more useful
for detecting wake vortices.
The aircraft flew over the lidar system
shelter approximately 9 seconds before this scan began. Assuming an aircraft
speed of 75 m/s, the vortices age in Figure 9.10 and Figure 9.11 can be
calculated to be approximately 16 seconds old in range gate 2, 18 seconds old
in range gate 4, etc.
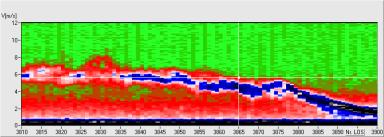
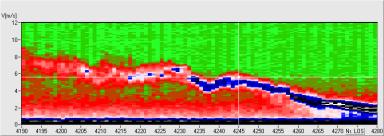
Vortices
from other aircraft types in the FOV
Detection of many other types aircraft has
been demonstrated, including other medium sized aircraft (e.g. B737 and MD80)
and some smaller aircraft (e.g. FOKKER 100 and BAC 146).
It can be stated that the MFLAME
Demonstrator was successfully operated on ground in a configuration similar to
a forward-looking airborne sensor. The analysis of the results has demonstrated
the feasibility of the system for wake-vortex detection, even for the detection
of vortices generated by small size aircraft.
By accumulation of several lidar shots,
long-range wind measurements can be carried out, which is important for
multi-function applications, like wind-shear detection.
The acquired results are appropriate for
system scaling with respect to laser energy, pulse repetition rate, optics
diameter, scanner performance, frequency estimator, and so on.
To define an operational equipment, well
integrated in the aircraft system and able of reliable hazard detection without
false alarms, further work is expected to obtain a complete statistical
analysis of the MFLAME recordings and to design an automatic wake-vortex
pattern recognition.
Figure 9.10: Radial velocity images with A320
wake vortices in the FOV.
The left panel shows the average top view
representation of the estimated mean radial velocity, while the right panel
shows individual range gate images. The mean radial velocity of each range gate
images has been removed. The ‘+’ symbols on the top view image mark the centres
of the range gate images shown. Tick marks on the range gate images are
separated by 20 meters on each axis of each image.
Figure 9.11: Spectral width images with A320
wake vortices in the FOV.
The left panel shows the average top view
representation of the estimated spectral width, while the right panel shows
individual range gate images. The ‘+’ symbols on the top view image mark the
centres of the range gate images shown. Tick marks on the range gate images are
separated by 20 meters on each axis of each image.
After collection of user requirements for
airborne detection of wake-vortices and other atmospheric hazards, a future
equipment has been defined and a demonstrator has been built.
The demonstrator has been installed at the
extremity of a runway on Toulouse airport so as to enable measurements in a
configuration very close to an on-board detection from a follower aircraft.
This “airborne-like” detection has been
successful. The tracking method as well as the signal processing constitutes a
world premiere that has demonstrated the feasibility of an airborne equipment.
Industrial equipment for detection, warning
and avoidance of wake-vortex, windshear and other atmospheric hazards could be
brought to market within 5 to 8 years.
To achieve this goal, it is important to
progress in the system integration of the MFLAME concept. This global approach
should be the subject of further work with two major objectives:
- On board system integration with study of
detection, warning and avoidance aspects, including avoidance manoeuvre trials
in a flight simulator and flight tests.
- ATC and ground system integration, taking
into account links with board system, to finally demonstrate how the
operational capacity and safety of aircraft can be improved.