
h/H parametrization
Description
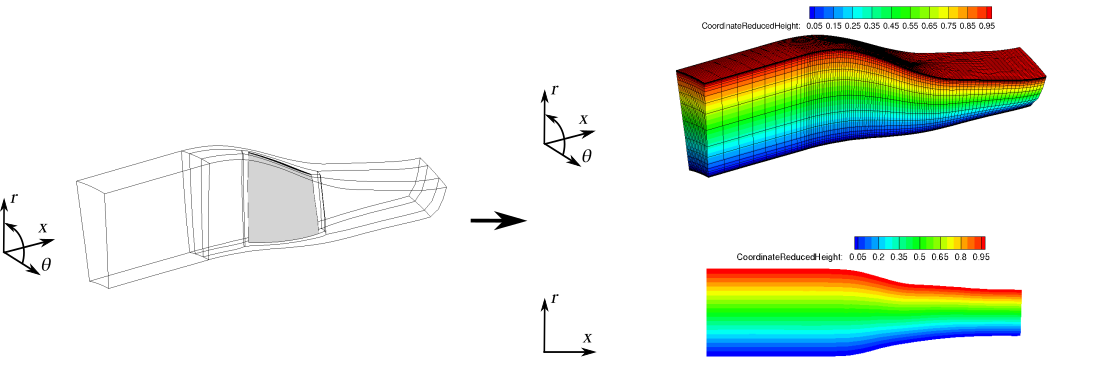
Parameterize the grid.
Construction
import antares
myt = antares.Treatment('hh')
Parameters
- base:
Base The input base.
- base:
- families:
list List of family names associated to the turbomachine rows.
Example: [‘ROW1’, ‘ROW2’, ‘ROW3’, ‘ROW4’]
- families:
- hub_pts:
ndarray Points of the meridional hub line. May be computed with
antares.treatment.turbomachine.TreatmentMeridionalLine.
- hub_pts:
- shroud_pts:
ndarray Points of the meridional shroud line. May be computed with
antares.treatment.turbomachine.TreatmentMeridionalLine.
- shroud_pts:
- number_of_heights:
int, default= 5 Number of points for the CoordinateReducedHeight direction. number_of_heights + 2 is one dimension of the 2D parameterization grid.
- number_of_heights:
- dmax:
float, default= 1.0e-05 Maximum distance in metre between two points in a spline discretization.
- dmax:
- precision:
float, default= 1.0e-05 Maximum distance in metre between two points in a spline discretization.
- precision:
- extension:
float, default= 10.0e-03 Length extension of meridional splines to compute parametrization grid.
- extension:
- coordinates:
list(str), default= antares.core.GlobalVar.coordinates The ordered names of the mesh cartesian coordinates.
- coordinates:
- flow_type:
strin [‘axial’, ‘other’], default= ‘axial’ Characterize the flow in the turbomachine. Used to set extension points of hub and shroud meridional lines (see key extension).
- flow_type:
- output_dir:
str, default= None Directory name for output files. If None, then no output files are written.
- output_dir:
- coprocessing:
bool, default= False Deactivate code lines if coprocessing with a CFD solver. This avoids a conflict with the symbol splint that appears in both the CFD code and scipy.
- coprocessing:
Preconditions
Rotation axis must be in the ‘X’ direction
shroud_pts and hub_pts must be a 2D list
The name of the elements in each family must be identical to the name of the zone associated to it. For example, if the base has three zones: “zone1”, “zone2” and “zone3”, the family must be built as follow:
family = antares.Family()
family['zone1'] = base['zone1']
family['zone2'] = base['zone2']
family['zone3'] = base['zone3']

# Doing something like the follow will fail:
# family['toto'] = base['zone3']
Postconditions
The treatment returns
the input base completed with the h/H parametrization variables at node location
CoordinateReducedMeridional
CoordinateSigma
CoordinateHeightFromHub
CoordinateHeightToShroud
CoordinateReducedHeight
the
Baseof the 2D structured parametrization grid
Example
import antares
myt = antares.Treatment('hh')
myt['base'] = base
myt['families'] = ['ROW1']
myt['hub_pts'] = np.array()
myt['shroud_pts'] = np.array()
hhbase, parambase = myt.execute()
Main functions
Example
import os

import antares

import numpy as np

import matplotlib as mpl
import matplotlib.pyplot as plt
mpl.use('Agg')
font = {'family':'serif','weight':'medium','size':40}
mpl.rc('font', **font)
mpl.rcParams['axes.linewidth'] = 2.0

output = 'OUTPUT'
if not os.path.isdir(output):
    os.makedirs(output)

r = antares.Reader('bin_tp')
r['filename'] = os.path.join('..', 'data', 'ROTOR37', 'ELSA_CASE', 'MESH', 'mesh_<zone>.dat')
r['zone_prefix'] = 'Block'
r['topology_file'] = os.path.join('..', 'data', 'ROTOR37', 'ELSA_CASE', 'script_topo.py')
r['shared'] = True
base = r.read()

r = antares.Reader('bin_tp')
r['base'] = base
r['filename'] = os.path.join('..', 'data', 'ROTOR37', 'ELSA_CASE', 'FLOW', 'flow_<zone>.dat')
r['zone_prefix'] = 'Block'
r['location'] = 'cell'
r.read()

print(base.families)

archi_fams = {
    'ROWS':   [['superblock_0000']],
    'HUB':    [['HUB']],
    'SHROUD': [['CASING']]
}

tre = antares.Treatment('MeridionalLine')
tre['base'] = base
tre['families'] = archi_fams
hub_points, shroud_points = tre.execute()

# Definition of the treatment
tr = antares.Treatment('hH')
tr['base'] = base
tr['families'] = ['superblock_0000']
tr['hub_pts'] = hub_points
tr['shroud_pts'] = shroud_points
tr['extension'] = 0.1
tr['output_dir'] = output
hhbase, paramgrid = tr.execute()

print(hhbase[0][0])

writer = antares.Writer('bin_tp')
writer['filename'] = os.path.join(output, 'ex_hh.plt')
writer['base'] = hhbase
writer.dump()
writer = antares.Writer('bin_tp')
writer['filename'] = os.path.join(output, 'ex_paramgrid.plt')
writer['base'] = paramgrid
writer.dump()

archi_fams = {
    'ROWS':    [['superblock_0000']],
    'HUB':     [['HUB']],
    'SHROUD':  [['CASING']],
    'INLETS':  [['INLET']],
    'OUTLETS': [['OUTLET']],
    'BLADES':  [ {'SKIN': [ ['BLADE'] ],
                  'TIP': [ [] ]}
               ]
}

tre = antares.Treatment('meridionalview')
tre['base'] = base
tre['param_grid'] = paramgrid
tre['families'] = archi_fams
tre['hub_pts'] = hub_points
tre['shroud_pts'] = shroud_points
tre['extension'] = 0.1
tre['height_value'] = 0.1
component = tre.execute()

# ---------------------------------------
# Display geometry
# ---------------------------------------
fig = plt.figure(figsize=(30,20), dpi=300, facecolor='w', edgecolor='k')
ax = fig.add_subplot(111)
ax.set_aspect('equal', adjustable='datalim')
meridional_lines = {}
meridional_lines['Hub'] = hub_points
meridional_lines['Shroud'] = shroud_points
for idx, row in enumerate(component['Row']):
    for jdx, blade in enumerate(row['Blade']):
        list_of_points = blade['profiles']
        for i, profile_3D in enumerate(list_of_points):
            name = 'row_%d_blade_%d_%d' % (idx, jdx, i)
            line = np.zeros((np.shape(profile_3D)[0], 2))
            line[:, 0] = profile_3D[:, 0]
            y = profile_3D[:, 1]
            z = profile_3D[:, 2]
            line[:, 1] = np.sqrt(y**2 + z**2)
            meridional_lines[name] = line
            i += 1

for part in meridional_lines.keys():
    ax.plot(meridional_lines[part][:, 0], meridional_lines[part][:, 1], linewidth=6)

for row in component['Row']:
    ax.plot(row['inletMeridionalPoints'][:, 0],  row['inletMeridionalPoints'][:, 1], linewidth=6)
    ax.plot(row['outletMeridionalPoints'][:, 0], row['outletMeridionalPoints'][:, 1], linewidth=6)
    for blade in row['Blade']:
        ax.plot(blade['LE'][:, 0], blade['LE'][:, 1], linewidth=6)
        ax.plot(blade['TE'][:, 0], blade['TE'][:, 1], linewidth=6)
        if 'rootMeridionalPoints' in blade:
            ax.plot(blade['rootMeridionalPoints'][:, 0],
                    blade['rootMeridionalPoints'][:, 1], linewidth=6)
        if 'tipMeridionalPoints' in blade:
            ax.plot(blade['tipMeridionalPoints'][:, 0],
                    blade['tipMeridionalPoints'][:, 1], linewidth=6)

ax.tick_params(which='major', width=2, length=20)
plt.savefig(os.path.join(output, 'meridional_view.png'), bbox_inches='tight')
plt.close()